Analysing Fiddler classic traces can be useful in scenario, when we are getting any errors while accessing the services in Microsoft 365. Lets say the user is opening his mailbox using https://outlook.office.com/mail/ or accessing any SharePoint Online site and getting any error, you can either Capture web requests with Fiddler or Capture a browser trace for troubleshooting.
Table of contents
What is Fiddler?
Fiddler is a web debugging proxy, using which we can inspect the incoming and outgoing traffic (HTTP or HTTPS or FTP) between the applications on the computer (on which fiddler tool is installed) and the internet.

The applications that uses HTTP and HTTPS will send the requests to fiddler, fiddler will then sends the request to the destination server over the internet. The destination server will send the response to the fiddler tool and then fiddler tool will send the response to the client applications which originated the requests.
By default, Fiddler Classic does not capture and decrypt secure HTTPS traffic. To capture data sent through HTTPS, enable HTTPS traffic decryption by Clicking Tools > Options > HTTPS and the Click the Decrypt HTTPS Traffic box.

Opening .saz or .har file.
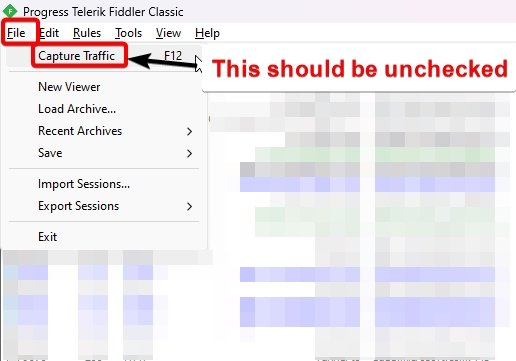
Before opening the .saz or .har file, please make sure that the capture traffic option in file section of Fiddler is unchecked. If the option is check marked then fiddler is actively capturing the traffic and displaying it in the sessions list, and if you open any previous capture in fiddler, then the previous capture sessions and the current session will be mixed and both of the session will show up in the sessions list.
If the traffic is captured using Fiddler tool, then it is saved in .saz file and if the traffic is captured using developer tools of any browser then it is saved in .har file.
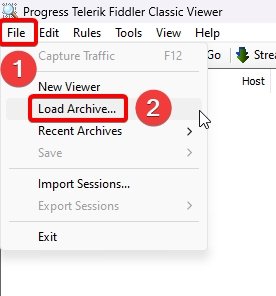
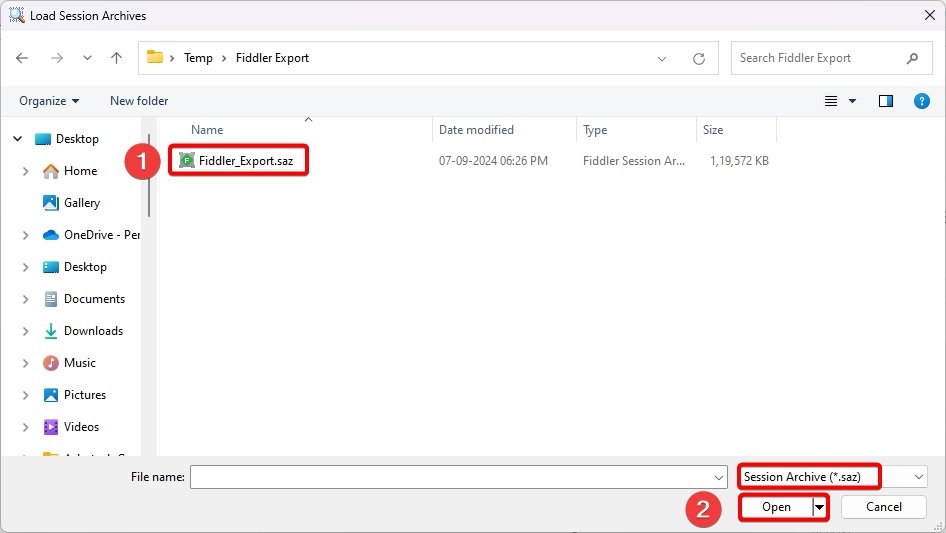
To open the .saz file in fiddler, select the File option and then select Load Archive option, after that select the .saz file to be opened.
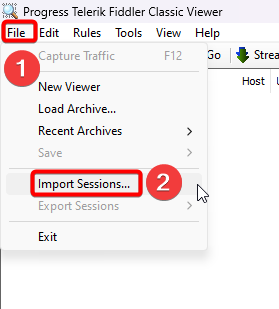
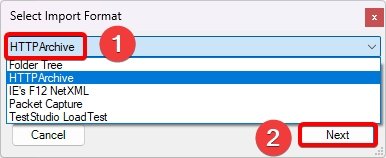
To open the .har file in fiddler, select the File option and then select Import Sessions, make sure the format should be selected as HTTPArchive, after that select the .har file to be opened.
Fiddler Columns.

Result.
It indicates the response code sent by the recipient / destination server to the client apps (user agents).
- 100 – 199 (Informational Responses): Shows that an initial part of the request was received by the server and the client app should continue to send further requests (if any).
- 100 – Continue: It indicates that the request has been received by the server (the request is not yet rejected by the server), The server intends to send a final response after the request has been fully received and acted upon.
- 200 – 299 (Successful responses): The client app request was successfully received, understood, accepted and processed by the server.
- 200 OK: Confirms that the request has succeeded.
- 201 Created: The request has been fulfilled and as a result a new resource is created on the destination server.
- 202 Accepted: The request has been accepted for processing, but the processing has not been completed yet.
- 204 No Content: Server has successfully fulfilled the request and that there is no additional content to send in the response payload body.
- 300 – 399 (Redirection messages): It indicates that further action needs to be taken by the user agent in order to complete the request.
- 301 Moved Permanently: The requested resource has been assigned a new permanent URI and the new URI is provided in the response. For all the future request, the new permanent URI should be used.
- 302 Found: The requested resource is temporarily moved to a different URI. For all the future request, the new temporary URI should be used.
- 303 See Other: The server redirects the client to different resource, and that resource will provide the response to the original request.
- 304 Not Modified: The resource which the client has is the latest (updated) one and it is not modified since the last time the resource was queried. There is no need to retransmit the resource.
- 400 – 499 (Client error responses): It shows that the Clients request has some errors.
- 400 Bad Request: The server cannot process the client’s current request due to the client error during creating the request (syntax of the request is incorrect, few fields of request are missing etc).
- 401 Unauthorized: The request to access the resource is not completed as it lacks valid authentication credentials for the target resource.
- 403 Forbidden: The client is not authorized to access the requested resource (The client does not have permission to access the resource).
- 404 Not Found: The server did not find the the target resource or is not willing to disclose that the target resource exists.
- 405 Method Not Allowed: The requested method received in the request is known to the server, but the method is not accepted (supported) by the target resource server. example: The client is trying to add or delete the read only resource on the target server.
- 408 Request Timeout: The server did not receive a complete request message within the time that it was prepared to wait.
- 500 – 599 (Server error responses): It indicates that the server is aware that it has error or is incapable of performing the requested action.
- 500 Internal Server Error: The server encountered an unexpected error that is preventing it from fulfilling the request.
- 502 Bad Gateway: The server received an invalid response from another internal server.
- 503 Service Unavailable: The server is currently unable to handle the request (may be server is shutdown for regular maintenance or updates).
- 504 Gateway Timeout: The server has not received a timely response from another internal server.
Protocol.
It indicates the protocol being used for the request. The protocol can either be HTTP (Hypertext Transfer Protocol) or HTTPS (secure HTTP).
Host.
It shows the web address of the recipient / destination server to which the request is sent to.
URL.
The complete URL of the requested resource.
Body.
The number of bytes in the response body.
Caching.
This field will show responses from the headers named cache-control and expires from the response.
- Cache-Control is an HTTP header that specifies how resources are cached.
- public: the resource can be cached by any intermediate cache.
- private: the resource can only be cached by a specific user agent.
- no-cache: means that a browser may cache but the resource must be revalidated by the user agent before it can be used from the cache
- no-store: the resource should not be stored in the cache at all. The resource must be requested from the server each time it’s necessary.
- must-revalidate: The cache must revalidate the response with the origin server once it becomes stale.
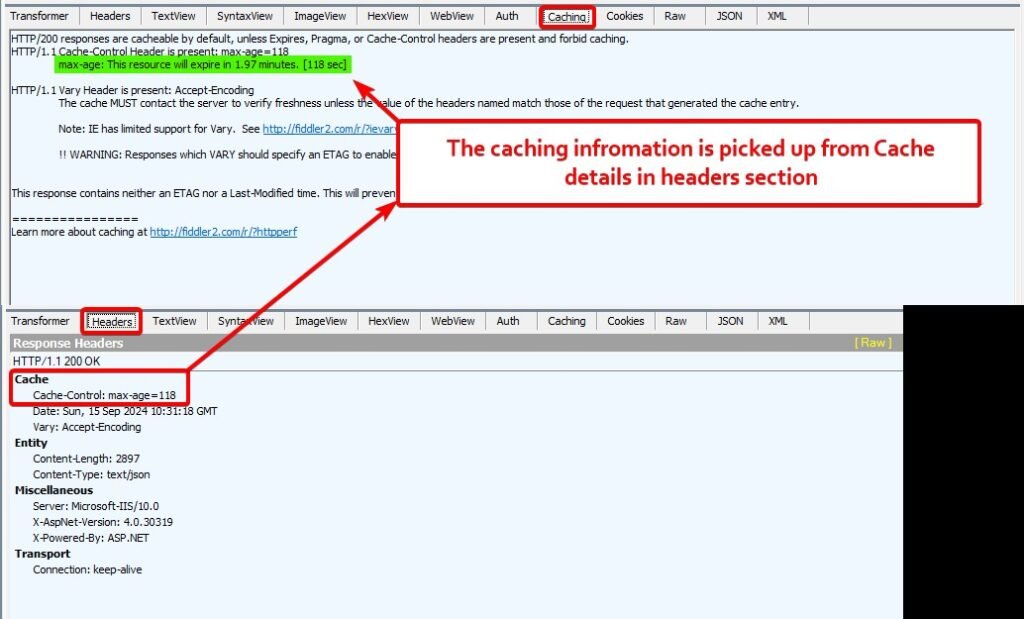
- max-age: the amount of time it takes for a cached copy of a resource to expire. After expiring, a browser must refresh its version of the resource by sending another request to a server.
- Expires header specify an absolute date and time at which a resource will expire and should be revalidated. Example: Expires: Sun, 08 Sep 2024 16:00:00 GMT
Content-Type.
The Content-Type header shows the media type of the resource.
- Content-Type: “application” is used to transmit application data.
- Content-Type: “video” is used to transmit video.
- Content-Type: “multipart” is used to transmit the combination of different types of data into single message.
Please refer the link to check the possible value of content-type
Process.
The Local OS process name and the process id which initiated the request. Example olk:13278, chrome:30285
Comments.
Shows the comment set by the user for the specific web session.
Custom Columns.
You can create custom columns to show the specific data from request and response headers and body.
Example: If I want to view the request method for any session, without clicking on the specific web session, then I will right click on any column and select customize columns option, then I will select miscellaneous in the collection field, header name will be RequestMethod and the display name would be what ever you want to display name of the column to be.
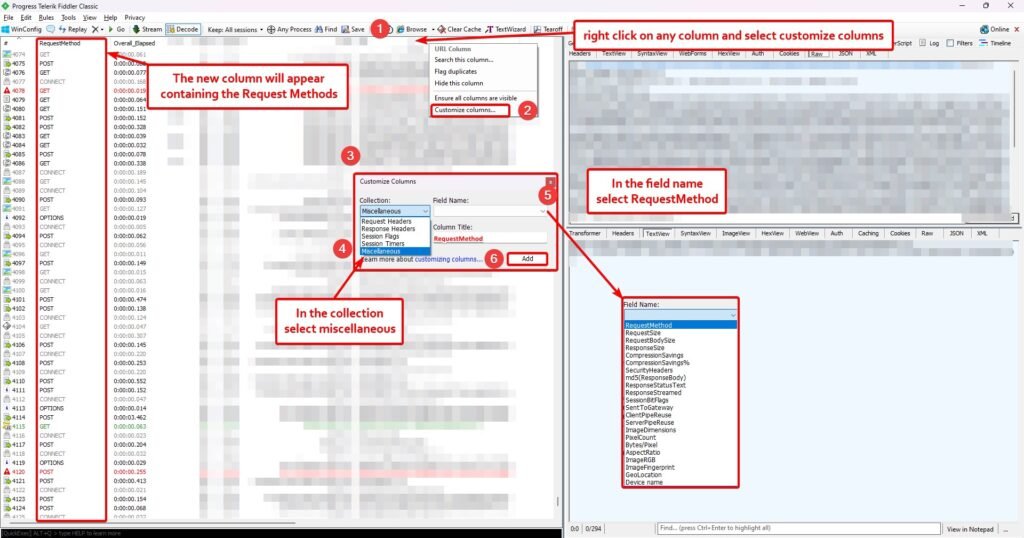
Similarly, you can create different custom columns using different fields from request and response headers.
Relevance of colours in session list.
Many times you might have seen multiple sessions are shows in different colours in fiddler, those different colour indicates different types of request and responses.

- Yellow for authentication requests.
- Purple for CSS response.
- Gray for images in response / Connection request also shows in Gray.
- Blue for html.
- Green for script.
- Red for errors.
Preparing the web sessions for viewing.
A Web Session refers to a single transaction between a client and a server. Every session will be shows a s a single entry in the web sessions list (shown in the left hand side part of the fiddler). As fiddler captures all the traffic for HTTP and HTTTPS, it will capture multiple content types (images) browser and non browser data. We can use different filters to show data which is related to our troubleshooting and hide other data from Fiddler.
Remove sessions from web session lists.
If you are troubleshooting an error related to the issue, unable to open mailbox, then in this scenario the responses where images are present are of no use. we can select the Remove sessions from web session lists option and then by selecting the Images option.
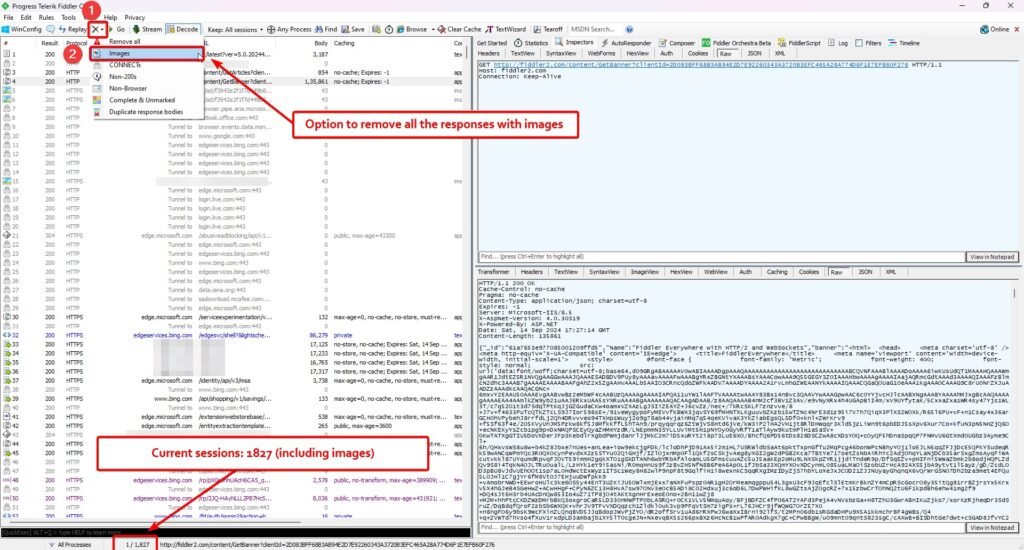
After selecting the Images option, from the Remove sessions from web session lists option, the total number of web sessions is now reduced to 1626.

You can press ctrl + z to restore all the responses with the images back in the sessions list.
NOTE: The ctrl + z does not work every time, hence it is important to save the fiddler responses to a file and then make the changes in the fiddler web session list.
We also have the below options in the Remove sessions from web session lists settings.
- Remove All: This option will remove all the sessions in the web session list.
- CONNECTs: This option will remove all the connect request for HTTP protocol (tunnel to).
- non-200s: This option will remove all the responses that does not have the result as 200.
- Non-Browser: Any non browser traffic will be removed from the web session list, example: PowerPoint, PowerShell, but the traffic from the processes like chrome, msedge will stay in the web session list.
- Complete & Unmarked: This removes Sessions for which the responses are received, the session which are unmarked or have no Comment set.
- Duplicate response bodies: This removes all the sessions that does not have no response body or has a response body identical to one received in another Session.
Decoding the encoded sessions.
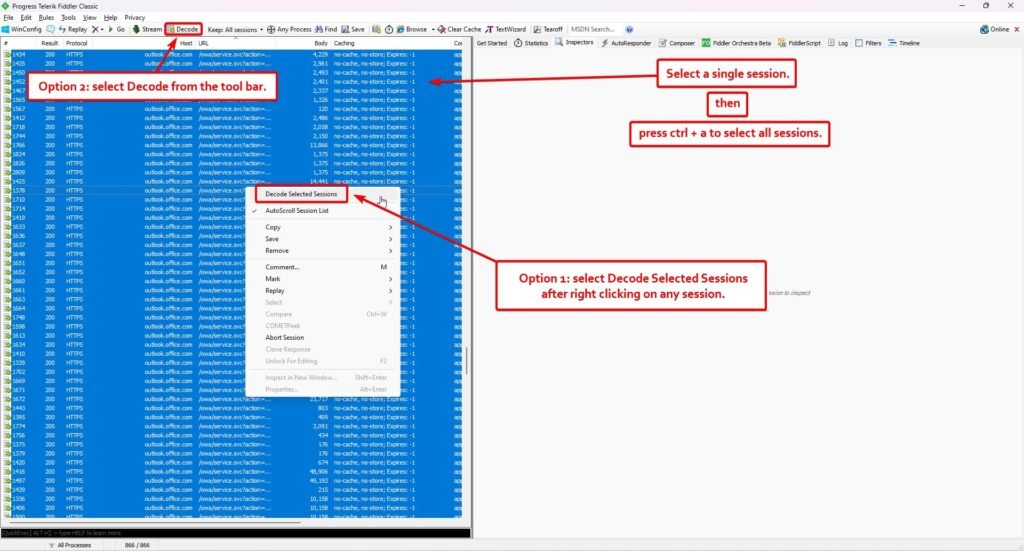
Before analysing the web session, we have to decode all the encoded session by selecting one session first, then press ctrl + a to select all the sessions, then right click and select Decode Selected Sessions OR select Decode from the toolbar of Fiddler.
Analysing the web session.
Each single session in the web session list in Fiddler has a request and a response associated with it.
To analyse the web session, we need to select the inspector tab. On the top right hand side, the request of selected session will be displayed, and on the bottom right hand side, the response of the selected session will be displayed.
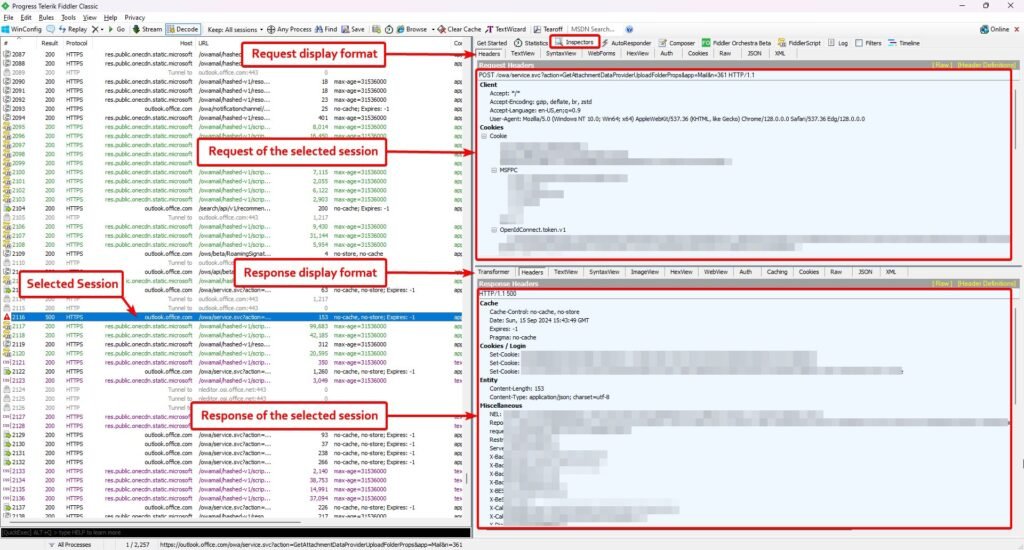
Request / Response display formats.
There are various display formats available to view the request and the response. Some display format are available for both request and response, and some are only available to either request or response.
- Headers (available for Request / Response): The request headers in the session shows what operation client wants to perform or what resource the client wants to access. The request headers consists of 3 parts HTTP Method (GET), the resource url (/imageB2/v1.0/users//image/resize(width=120,height=120,allowResizeUp=true)) and the HTTP version (HTTP/1.1). The response headers shows the response from the server for the request.
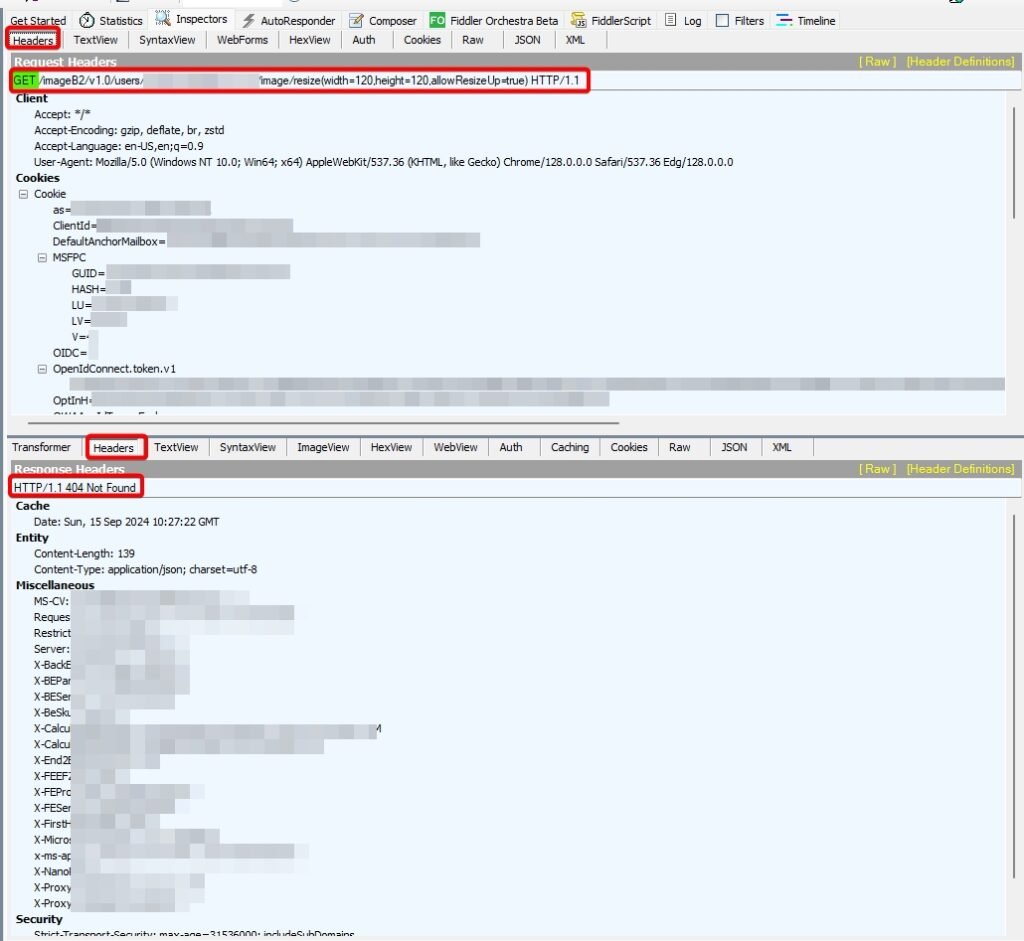
Below are the different HTTP Methods used with the request.
| HTTP Method | Description |
| GET | Use to retrieve (query) a specific resource, the server is expected to send the requested resource in the response. Example: the request GET https://outlook.office.com/imageB2/v1.0/users//image/resize HTTP/1.1 is asking the server to send the image for the user. |
| HEAD | HEAD is similar to GET request, the server will not send the actual data of the requested resource, instead the server will send the metadata of the data. Example: The client will send the HEAD request for testing hypertext links present on the target server for validity, accessibility, and recent modification. |
| POST | This method requests the target server to process the enclosed request. Example: the request POST https://outlook.live.com/owa/0/service.svc?action=GetAccountInformation&app=Mail&n=28 HTTP/1.1 is asking the server to get the account information for the logged in user. |
| PUT | Used to update the existing resource with new data on the target server. PUT can also create a new resource if there is none exist on the target server. |
| DELETE | Deletes the specific resource from the target server. |
| OPTIONS | Used to request the communication options supported for the target resource by the target server. Example: The request OPTIONS https://loki.delve.office.com/api/v1/livepersonacard/configuration?cultureName=en-US HTTP/1.1 Access-Control-Request-Method: GET shows that the client wants to send the GET resource request to the server, the response from the server will confirm if the target server accepts the GET method or not. |
- Raw (available for Request / Response): This will allows you to view all the content of request and response. View in notepad button in Raw will allow you to open the content of request and response in notepad.
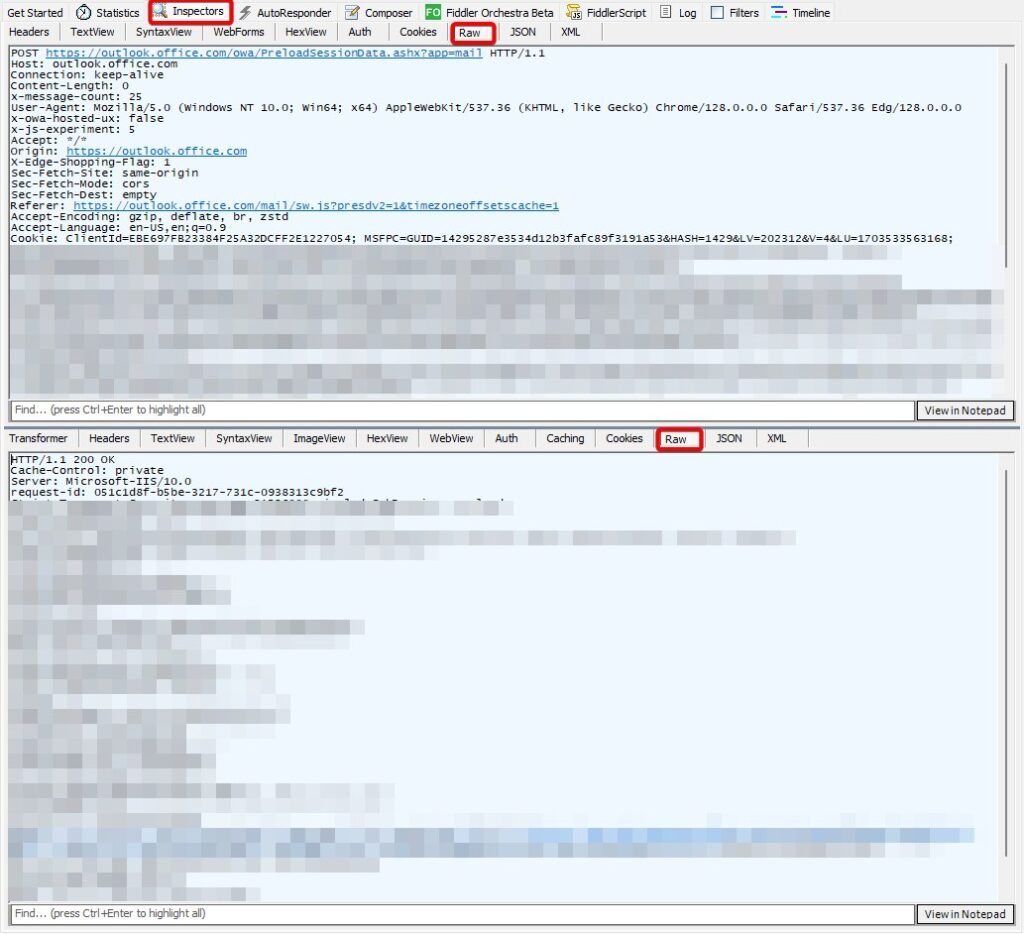
- Auth (available for Request / Response): This section will show the authentication and authorization results in the request and response of the session.
- Cookie (available for Request / Response): This inspector tab will display the content of any inbound or outbound cookies present in the headers.
- JSON (available for Request / Response): This field will parse the content of the request and response in JSON (JavaScript Object Notation). If the data in request and response cannot be parsed in JSON then the JSON inspector will show error or will not show any data (empty).
- XML (available for Request / Response): This inspector tab will show the data in request and response in XML (Extensible Markup Language) format. If the data in request and response cannot be parsed in xml then the xml inspector will show error or will not show any data (empty).
- TextView (available for Request / Response): The TextView inspector will show the request and response body in text format.
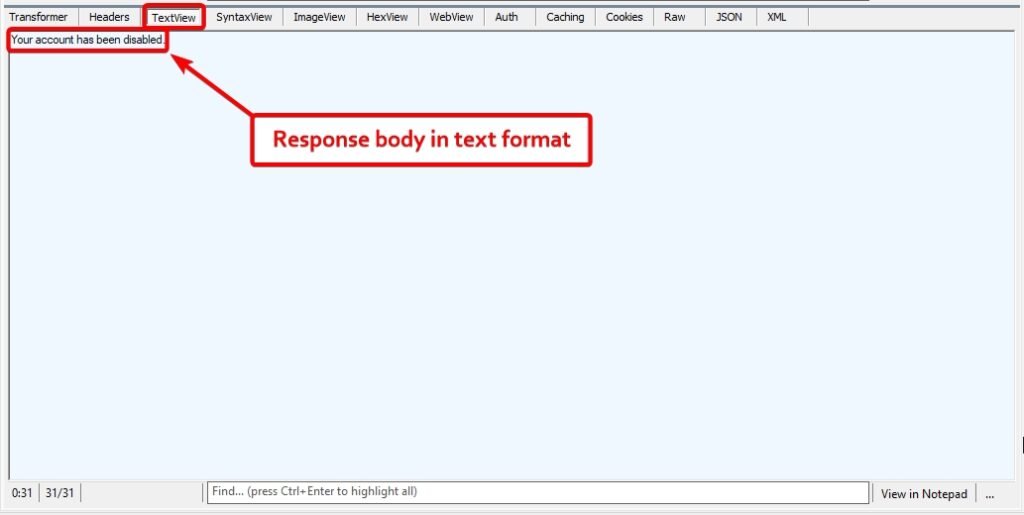
- SyntaxView (available for Request / Response): This view provides you the option to view the text in CSS, XML, script or JSON view.
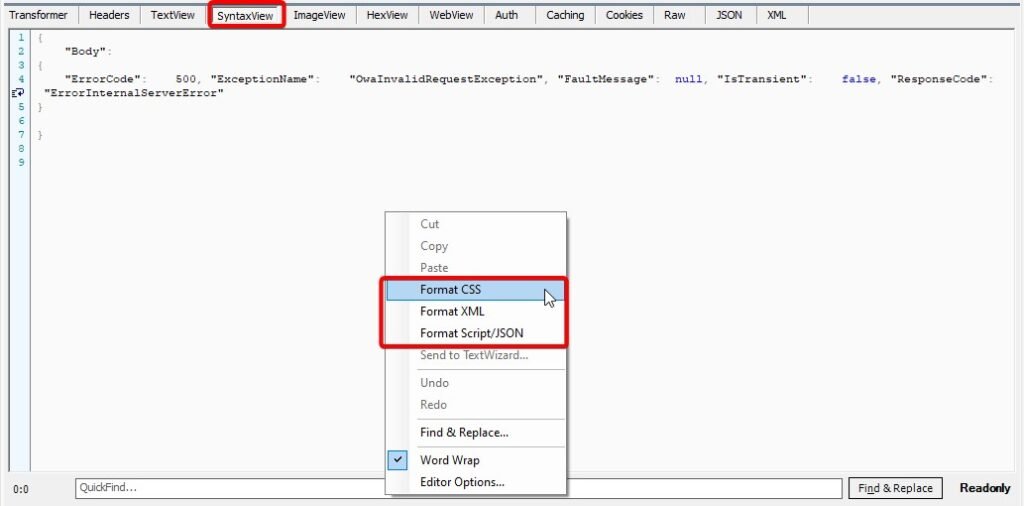
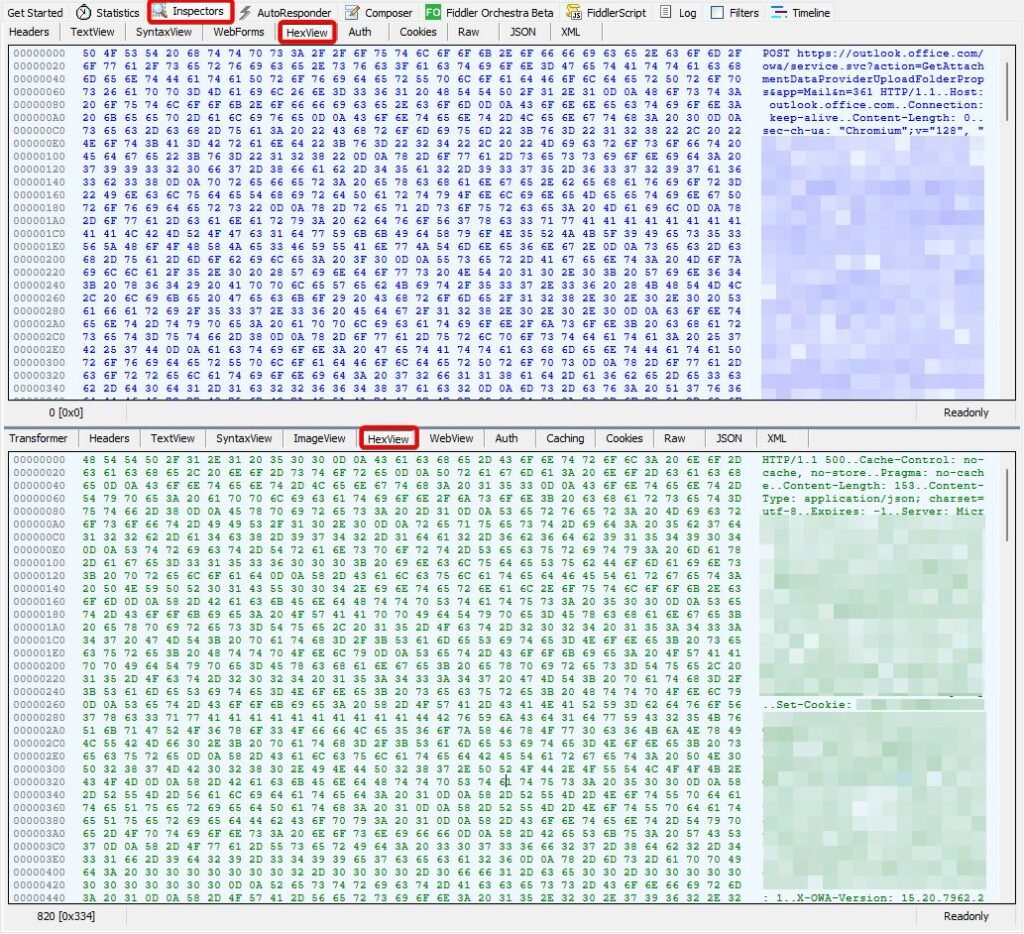
- HexView (available for Response / Response): This will show the headers and body in hexadecimal format, used to view the details of request and response in binary format.
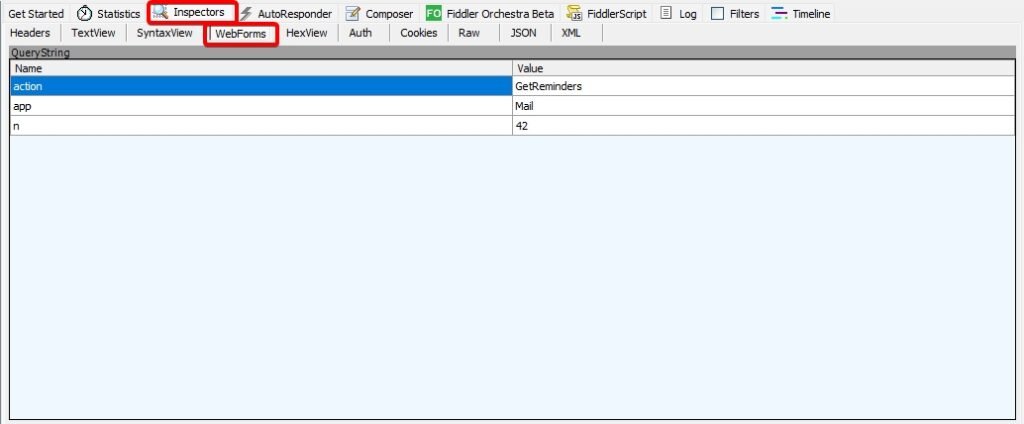
- WebForms (available for Request): This inspector view will show the request details in HTML form.
- Caching (available for Response): The data in this inspector will read the response header to confirm if the response is cached or not. The value of Caching field will be picked up from Cache field in headers of the response.
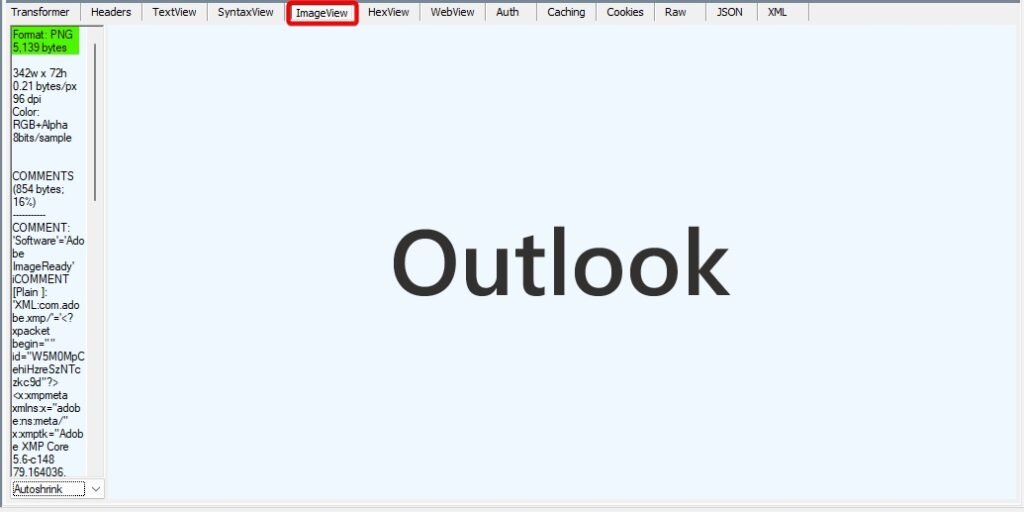
- ImageView (available for Response): This inspector view will show the images present in the response of the web session.
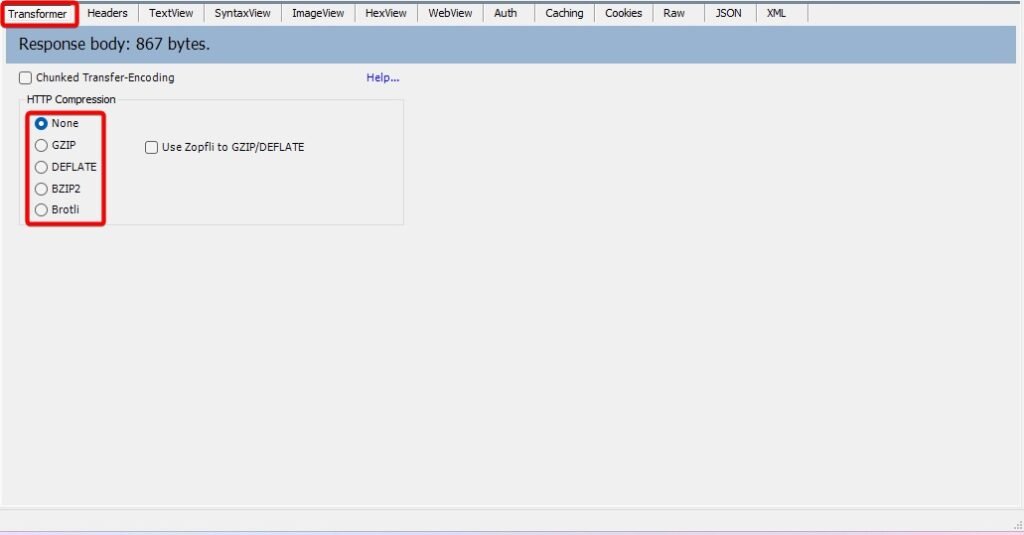
- Transformers (available for Response): This will help you to add or remove encoding for the selected web sessions.
Finding the web session.
If you press ctrl + f in the fiddler the Find box will appear which will allow us to search for different text in fiddler. Options field in the Find box will determine how the search will be conducted.
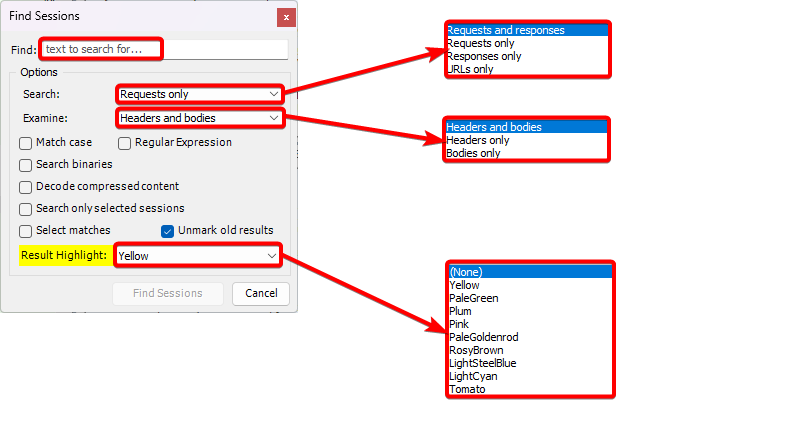
- Find: Type the text which needs to be searched in the fiddler web sessions.
- Options: Allows you to control the search.
- Search: Specify where the mentioned term will be searched.
- Request and responses (default): The term will be searched in request and response both.
- Request only: The term will be searched in only request.
- Response only: The term will be searched in only response.
- URLs only: The term will be searched in the header and body of url present in the request.
- Examine: confirms if you want the term to be searched in headers and body, or header only or body only.
- Headers and bodies (default): The term will be searched in both headers and body.
- Headers only: The term will be searched in only headers.
- Bodies only: The term will be searched in only body.
- Match case: When this box is selected, the term to be searched will become case sensitive.
- Regular Expression: The term to be searched will be considered as a regular expression.
- Search binaries: The term to be searched will be searched in binary data inside the session.
- Decode compressed content: This option will instruct fiddler to decode the responses before searching and then search for the term in the sessions.
- Search only selected sessions: If you select multiple web sessions list and then press ctrl + f then this option will be check marked and the term will only be searched in those previously selected sessions.
- Select match: If this option is check marked and if the fiddler finds the term, then all the sessions that contain the selected text will be selected at once.
- Unmark old results: This option will remove the highlighted colour marking from any previous search results.
- Result highlight: This option will let you select the colour which will be used to highlight the session which contains the text that was searched.
- Search: Specify where the mentioned term will be searched.
Viewing session statistics.
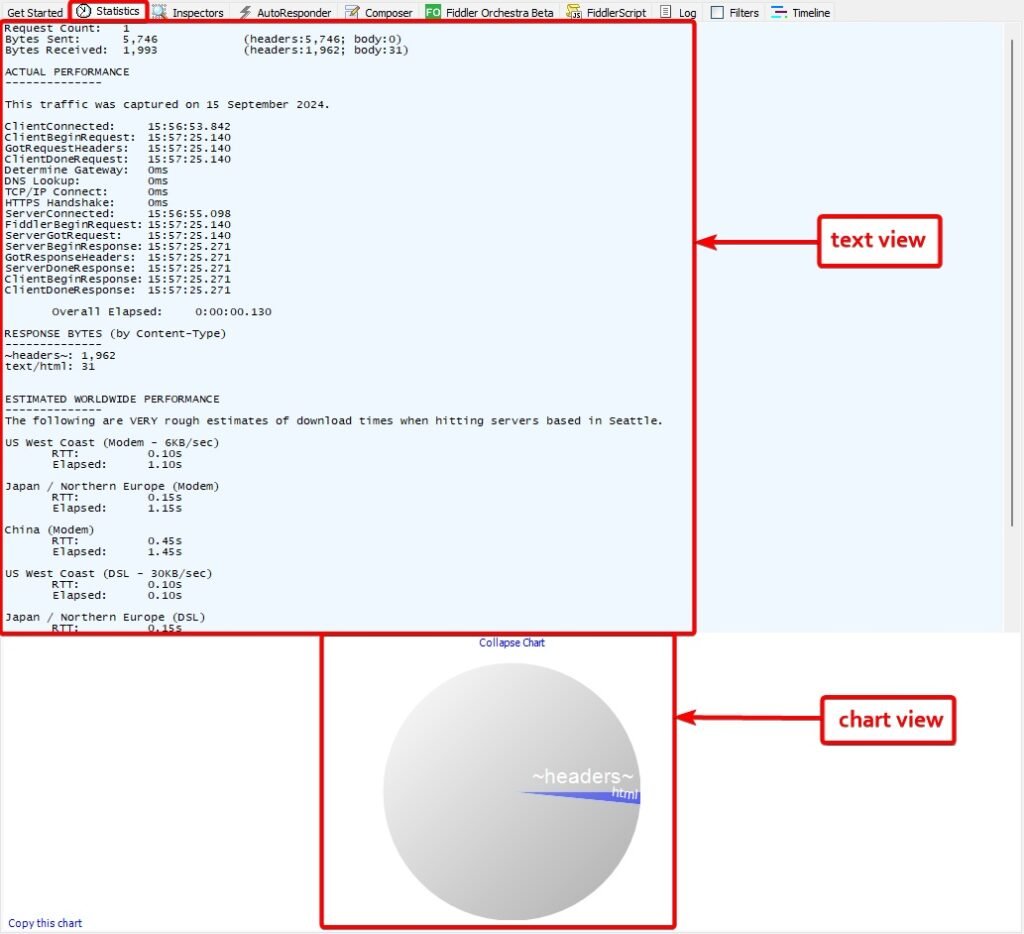
Session statistics will help you to check the network related details and performance about the currently selected session. The top section will show the details in text format while the bottom session will show the details of content type in pie chart format.
Below are the details of the fields shown in the session statistics.
- Request Count: The number of Sessions selected. (if you select 3 sessions and then select statistics option then this value will be 3).
- Bytes sent: The total number of outbound bytes sent in the header and body. Example: (headers:5,746; body:0). In headers total of 5,746 bytes were sent and in body total of 0 bytes was sent.
- Bytes received: The total number of inbound bytes received in header and the body. Example: (headers:1,962; body:31), In headers total of 1,962 was received and in body total of 31 was received.
- ClientConnected: The time when the client connected to fiddler (connection to the client and fiddler is established).
- ClientBeginRequest: The time when the client starts the send the request to fiddler.
- GotRequestHeaders: The time when the request headers were received by fiddler.
- ClientDoneRequest: The time when the request from client to fiddler is complete.
- Determine Gateway: The time taken by fiddler to calculate which gateway to be used to handle the requests.
- DNS Lookup: The time taken by fiddler to look up for DNS.
- TCP/IP Connect: Time taken by fiddler to wait for the server to establish the TCP/IP connection.
- HTTPS Handshake: Time spent by fiddler while performing HTTPS handshake with the server.
- ServerConnected: The time when the connection to the server was established.
- FiddlerBeginRequest: The time when fiddler started sending request to the server.
- ServerGotRequest: The time when fiddler has sent the request to the server.
- ServerBeginResponse: The time when fiddler received the response from the server.
- GotResponseHeaders: The time when fiddler received the response headers from the server.
- ServerDoneResponse: The time when fiddler received the complete response from the server (last response).
- ClientBeginResponse: The time when fiddler begin sending the response to the client.
- ClientDoneResponse: The time when fiddler has sent the last response to the client.
- Overall Elapsed: It is ClientDoneResponse – ClientBeginRequest time.
Scenario 1: Unable to login into mailbox.
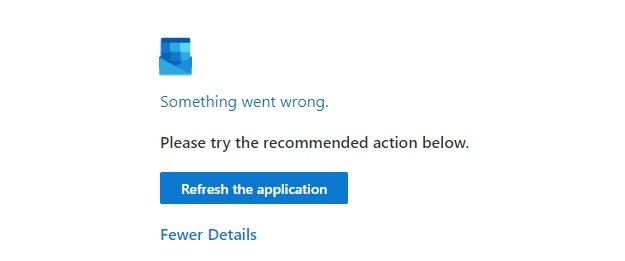
In this scenario, the user with email address Test_User@aashu.co.in is trying to open the mailbox but getting the below error.
Now when we open the fiddler to check the web session list, we have to make sure we select only the query, that contains the email address of the affected user. You can use the Find box to search for the affected email address or looking at the results column and check for any error code 5XX.
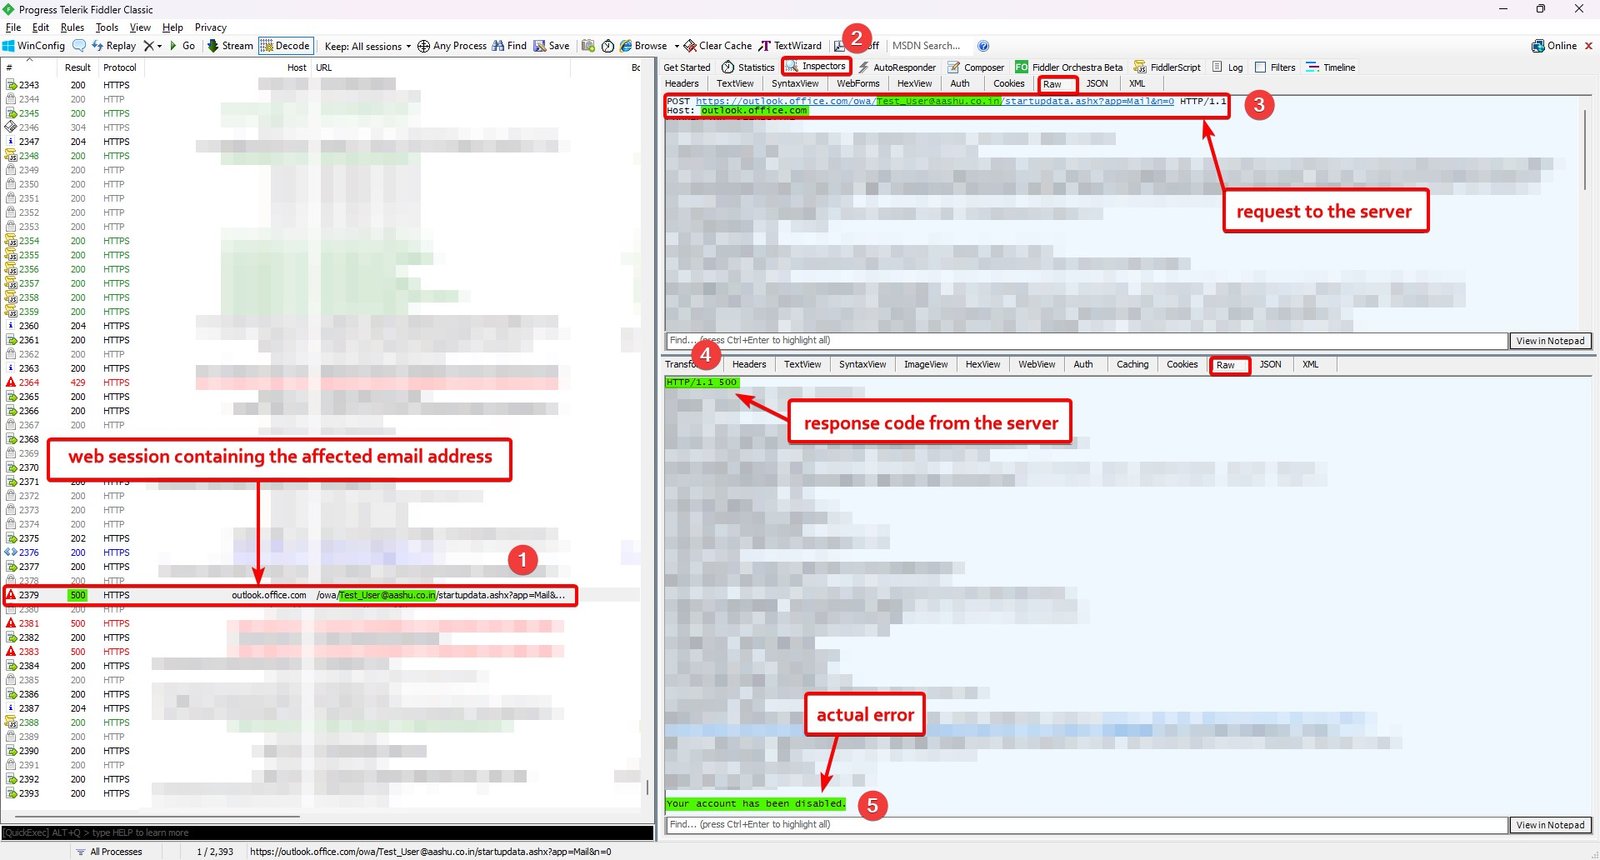
In the request section, the request is POST https://outlook.office.com/owa/Test_User@aashu.co.in/startupdata.ashx?app=Mail&n=0 HTTP/1.1 and the server response with error code 500 and the statement “Your account has been disabled.“
Now the resolution to the issue would be to enable to account for the user
Tips to analysing the logs.
Press ctrl + f and find the keyword “error”.
You can also look for the error code in the results section of the web session list.
Sometimes, the results section shows 200 OK, but if you check the response body, you may get the statement like “login blocked by the client access rule” or “limit exceeded”.
If you know the issue, then you can search for related url. Example: when the affected user tries to click on any folder in OWA then he gets an error “unable to read the data from the server”.
In this scenario, you should look for the query that has action=GetFolder&app=Mail in it, as the GetFolder&app asks the server to share the content of the folder which was clicked for the logged in user, and then we should check the response for the request.